
Climate-smart agriculture:
Big-data analysis to investigate what management practices work

|
During the summer of 2017, agriculture in the southern Prairies was hit by extreme drought. Such extreme weather events are increasingly likely with climate change. Although Canadian agriculture may benefit from some warming, more extreme weather will be harmful. Our project aims to develop the data sets and tools required to assess potential future climate impacts on crop production in the Canadian Prairie Provinces, as well as best management practices to help farmers adapt to climate change.
|
Our first objective was to develop statistical models to detect the influence of climate change on crop yields.
|
|
|
|
|
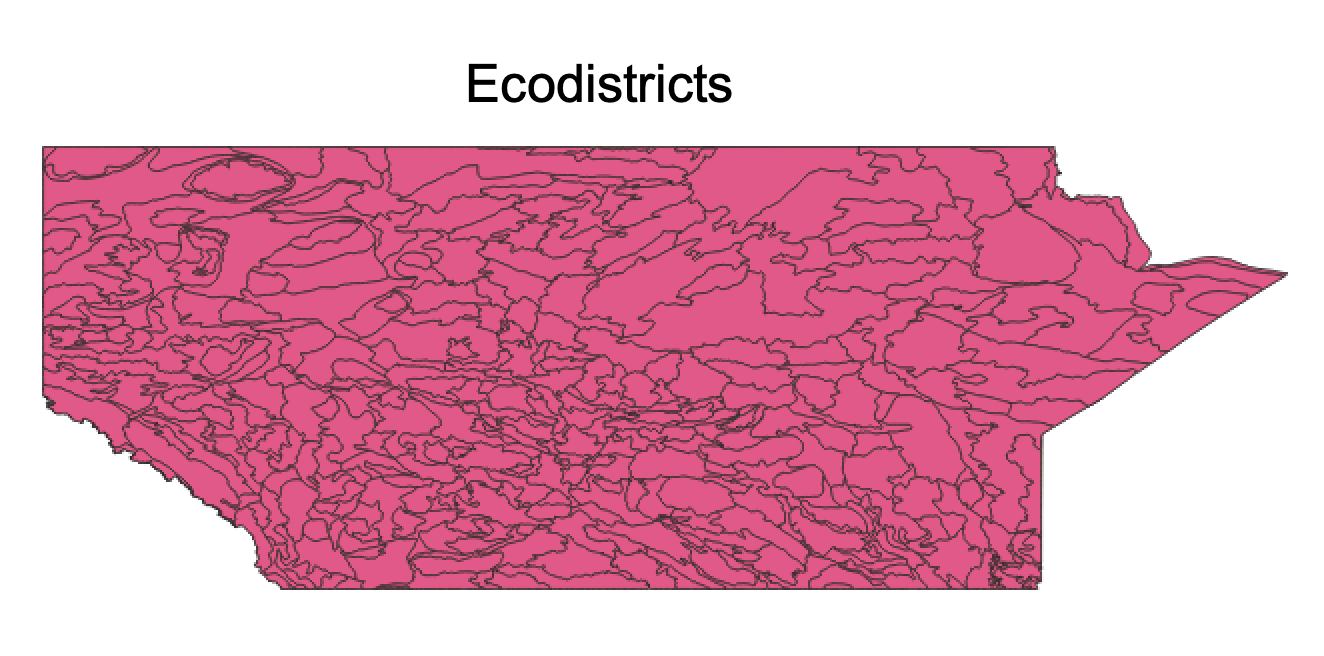
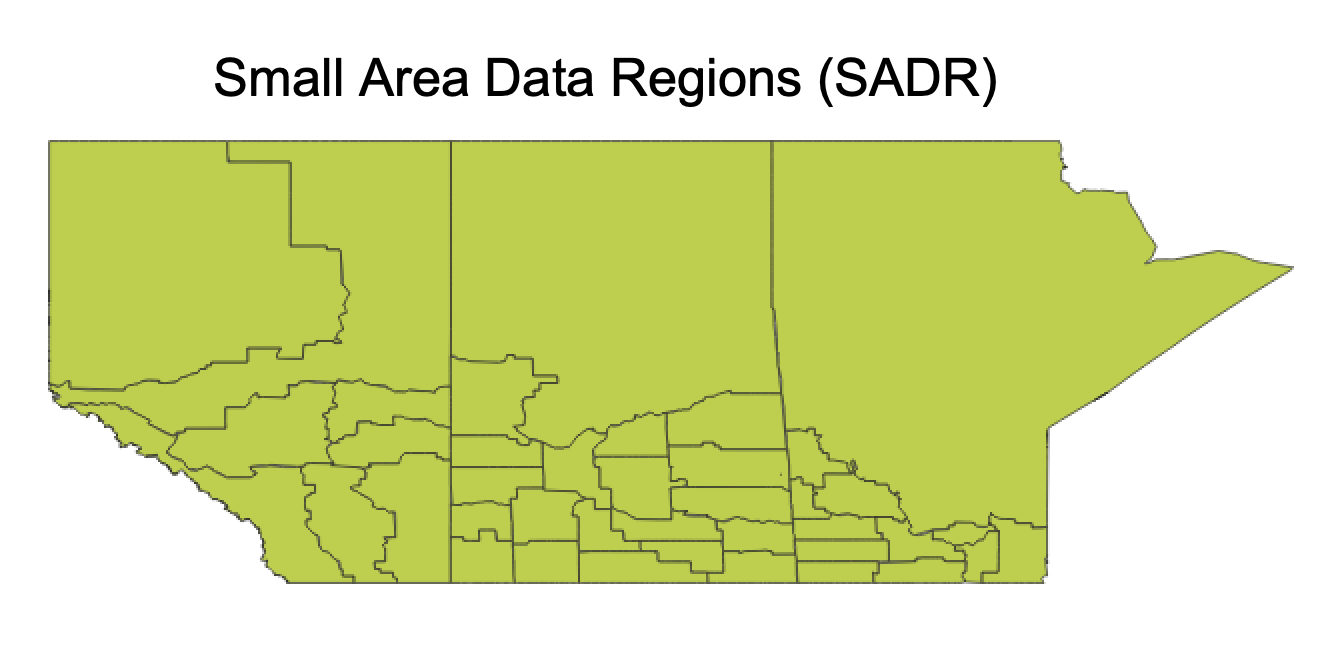
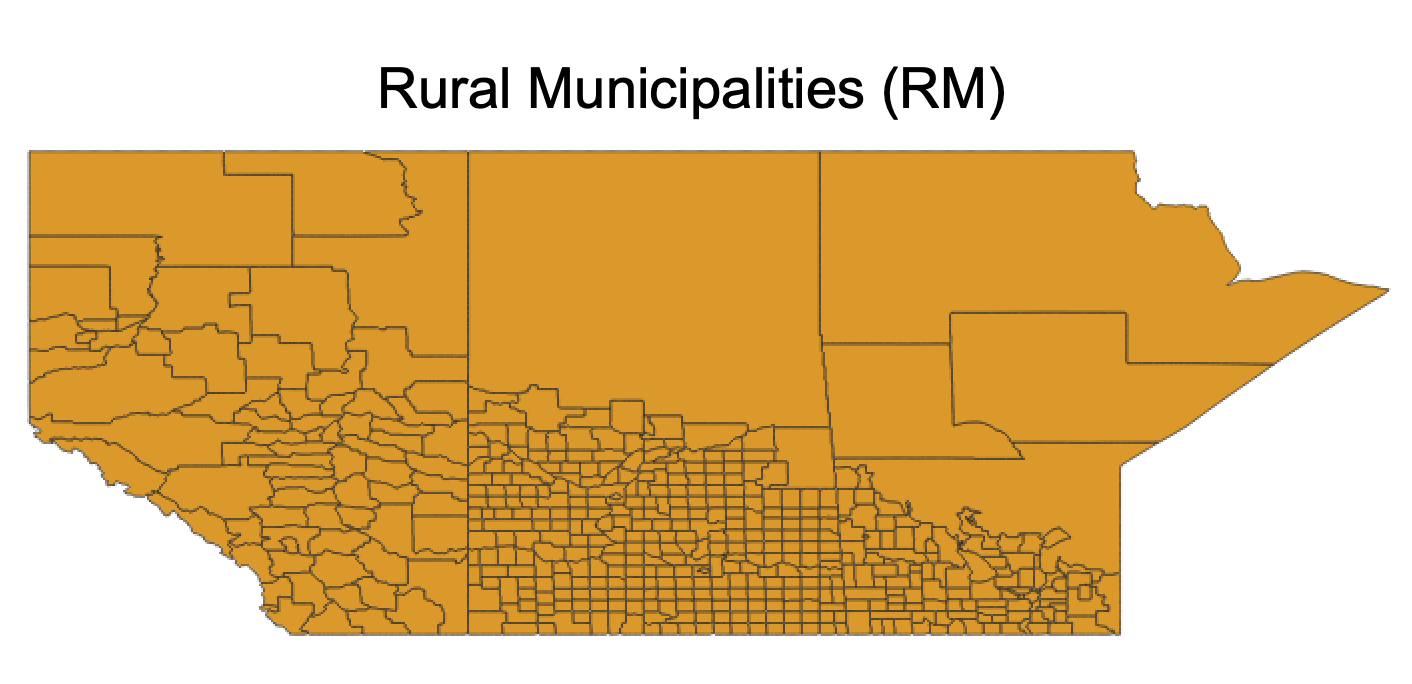
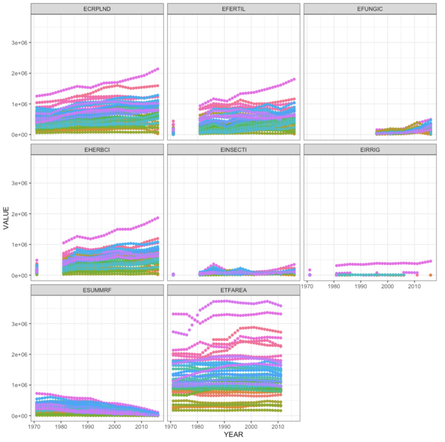
First, we gathered & harmonized data on
|
We found data at the
|
Our data cleaning process and scripts are contained in a GitHub repository.
The data are described in a metadata file and can be downloaded here.
The data are described in a metadata file and can be downloaded here.
|
|
|
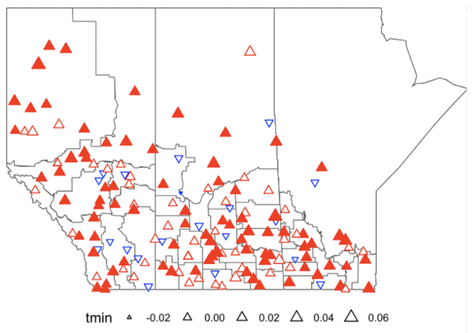
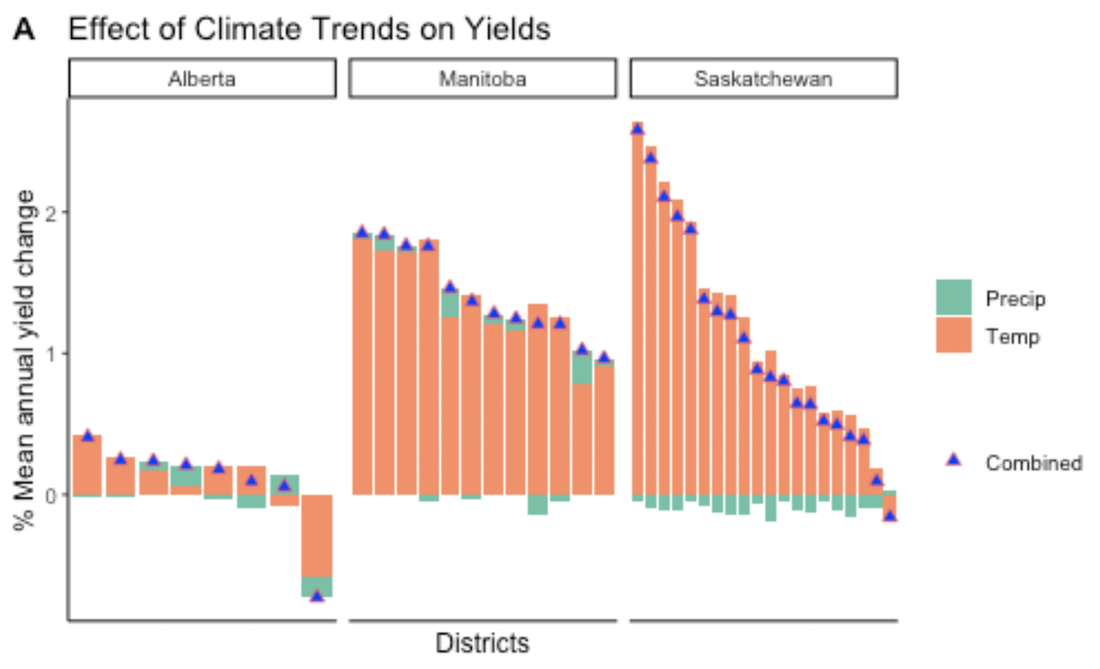
We looked at climate trends over the past four decades
|
We then isolated the effect of these climate trends on yield trends.
|
Interact with our Shiny app to explore our findings at the administrative unit level.
We also sought to investigate how farm management and landscape context influence the likelihood of crop yield losses to climate change.
|
|
What we found is that there are data gaps, shorter time series, and many administrative units not reporting on various management variables in the data we obtained from Statistics Canada.
This makes it difficult to run our statistical analysis for the same time series for which we have yield and climate data. We are still exploring ways to evaluate management impacts on climate resilience with the available data. |
Our second objective was to use regional climate projections to examine how different farm management practices may help alleviate future climate risks
|
See our Jupyter notebook for a reproducible workflow to download and downscale CMIP6 projections
(this can be used by other researchers interested in studying climate change impacts on Canadian agriculture)
(this can be used by other researchers interested in studying climate change impacts on Canadian agriculture)
Our third objective was to develop an open code base and easy-to-use methodology, and disseminate this to provincial governments and working groups so that our analysis can be readily applied to other regions in Canada
|
This has been done throughout, but please see:
Our GitHub repository for the cleaning and pre-processing of historical climate & management data
Our Jupyter notebook for the cleaning and pre-processing of the climate projection data
XXX for the processed data
YYY for the climate trend and forecast analysis code
Our Shiny App for the visualization of results
